Chapter 4 Missing values
Due to the scrap API that we are using, and the unstable columbia school network during the final week, there is some data missing from the original result csvs in our first several attempts.
Then we update the API call, using try-catch to detect the failures (i.e. 403 forbbiden, 401 unauthorized, 404 not found, API daily limitation reached, API quota used up…etc), and set up logics to re-try with waiting durations, so this helps us improve the data integration dramatically.
And here is how our data looks like during missing pattern check:
4.1 Missing Pattern Detection
Example for missing data detection (Data from November 2019), since we pulled the data on-demand and cleaned up, there is no missing data in our vidoe csv, as:

Note: If you are trying to use extracat::visna(sample,sort=“r”), you will get “Error in extracat::visna(df, sort =”r“) : No NA’s in the data. For indicator matrices please use visid(x, … ) and for factor data.frames there is visdf(x,freqvar)”.
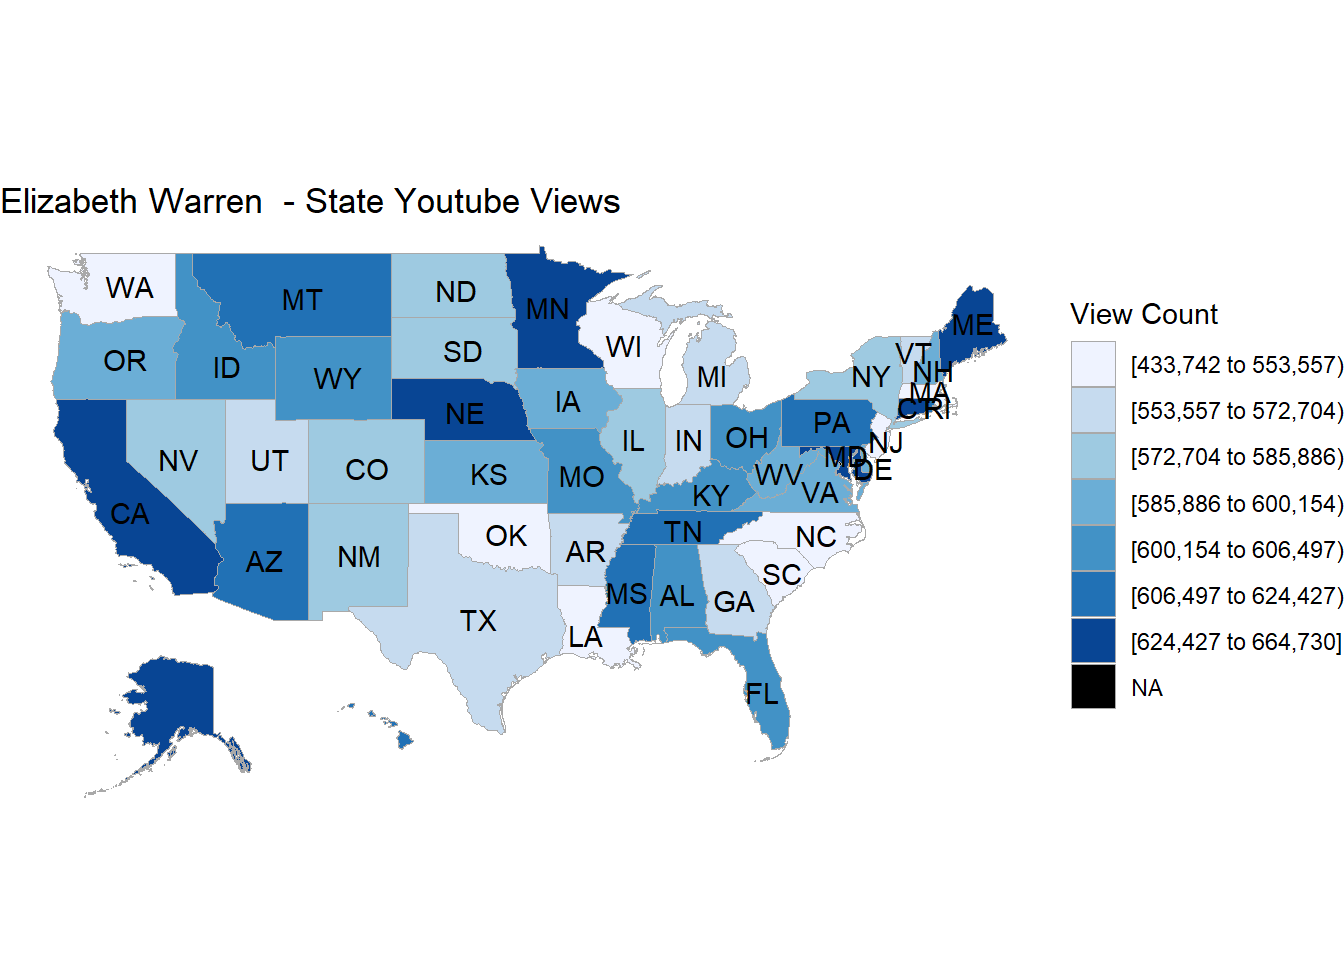
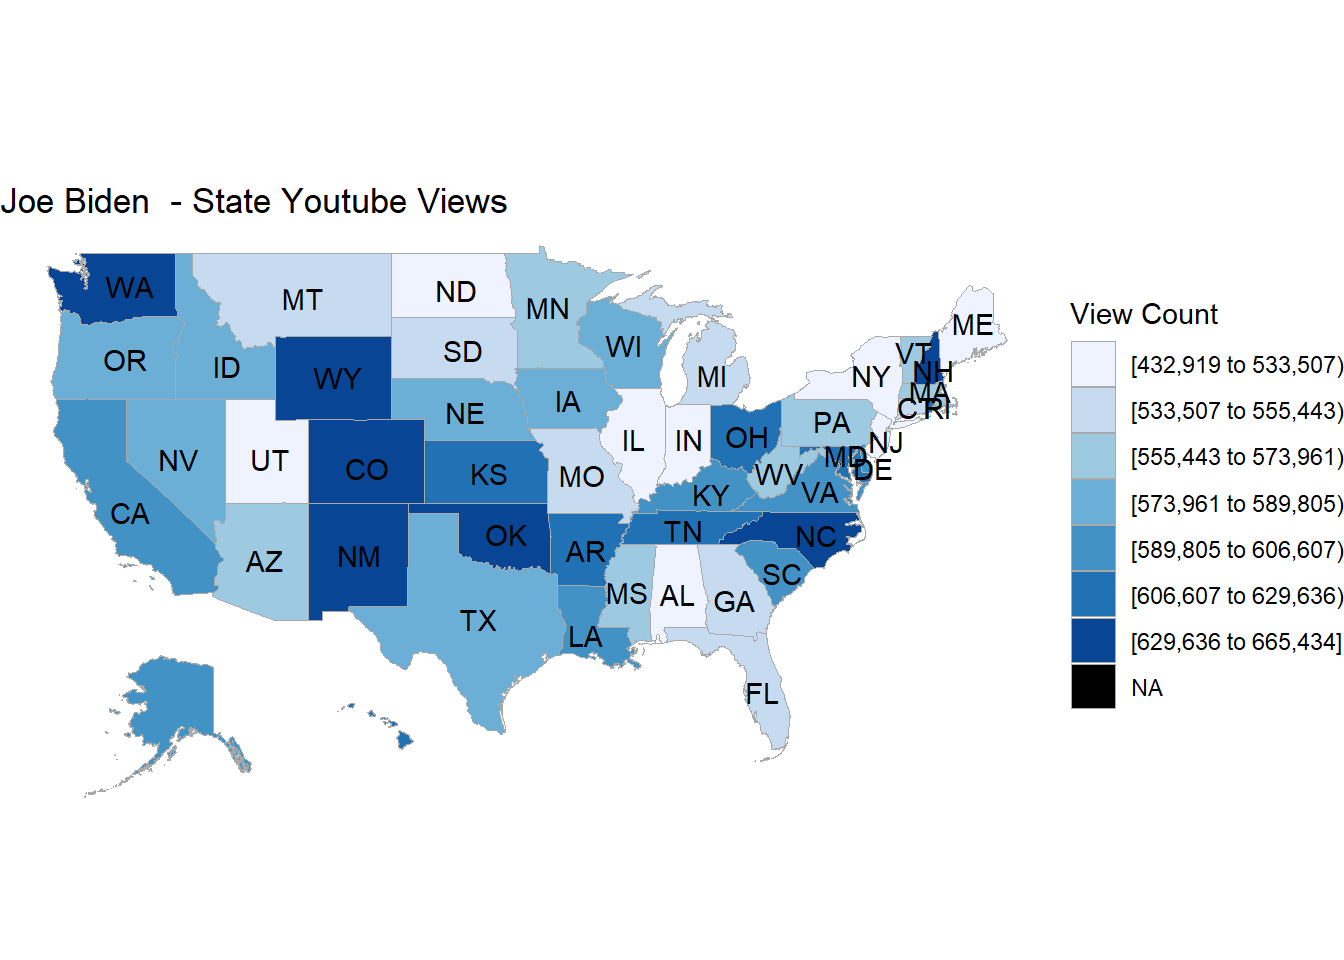
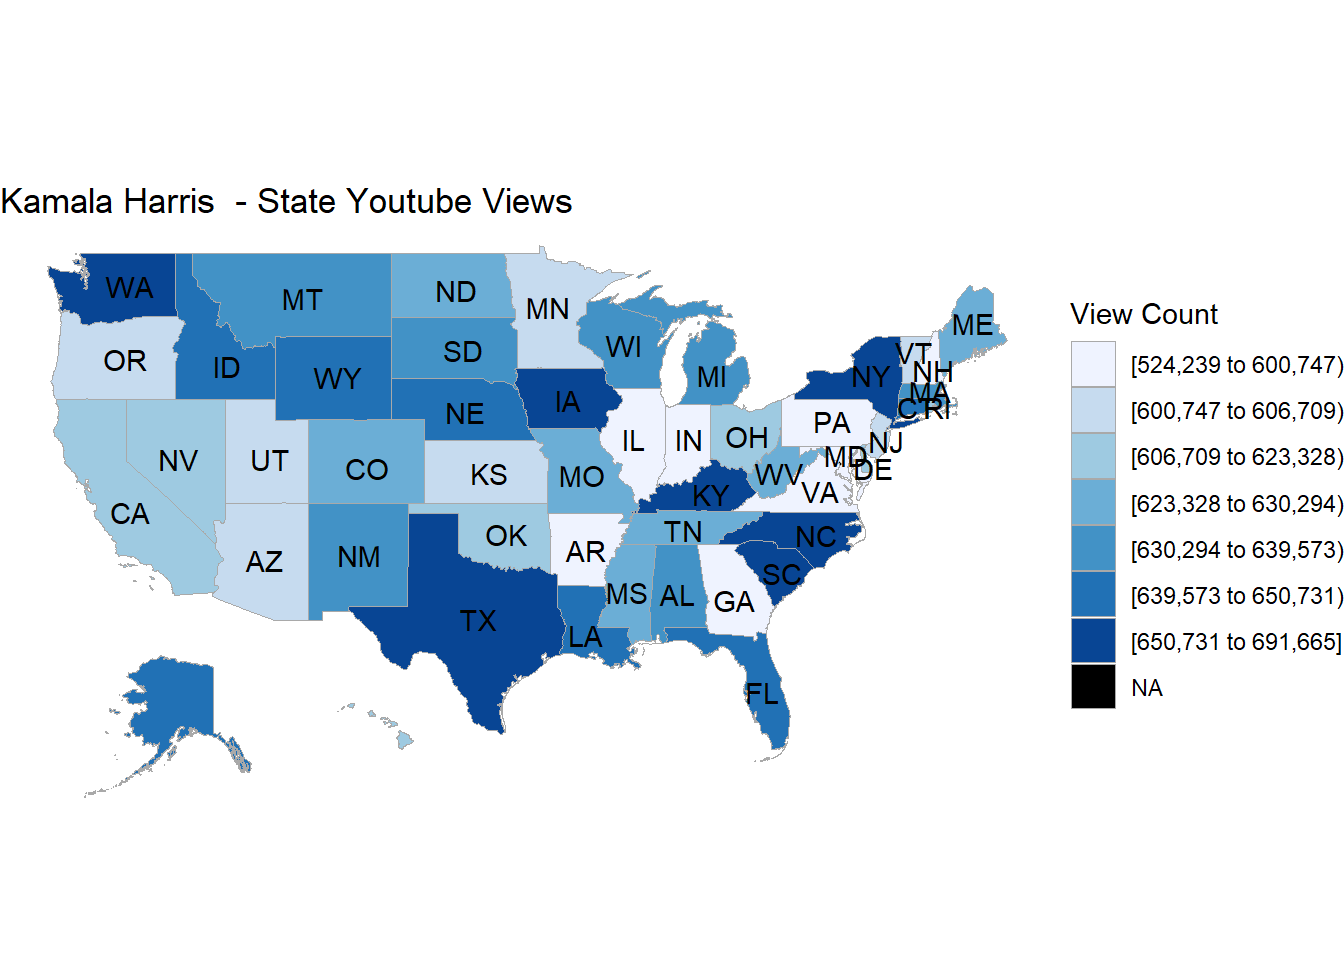
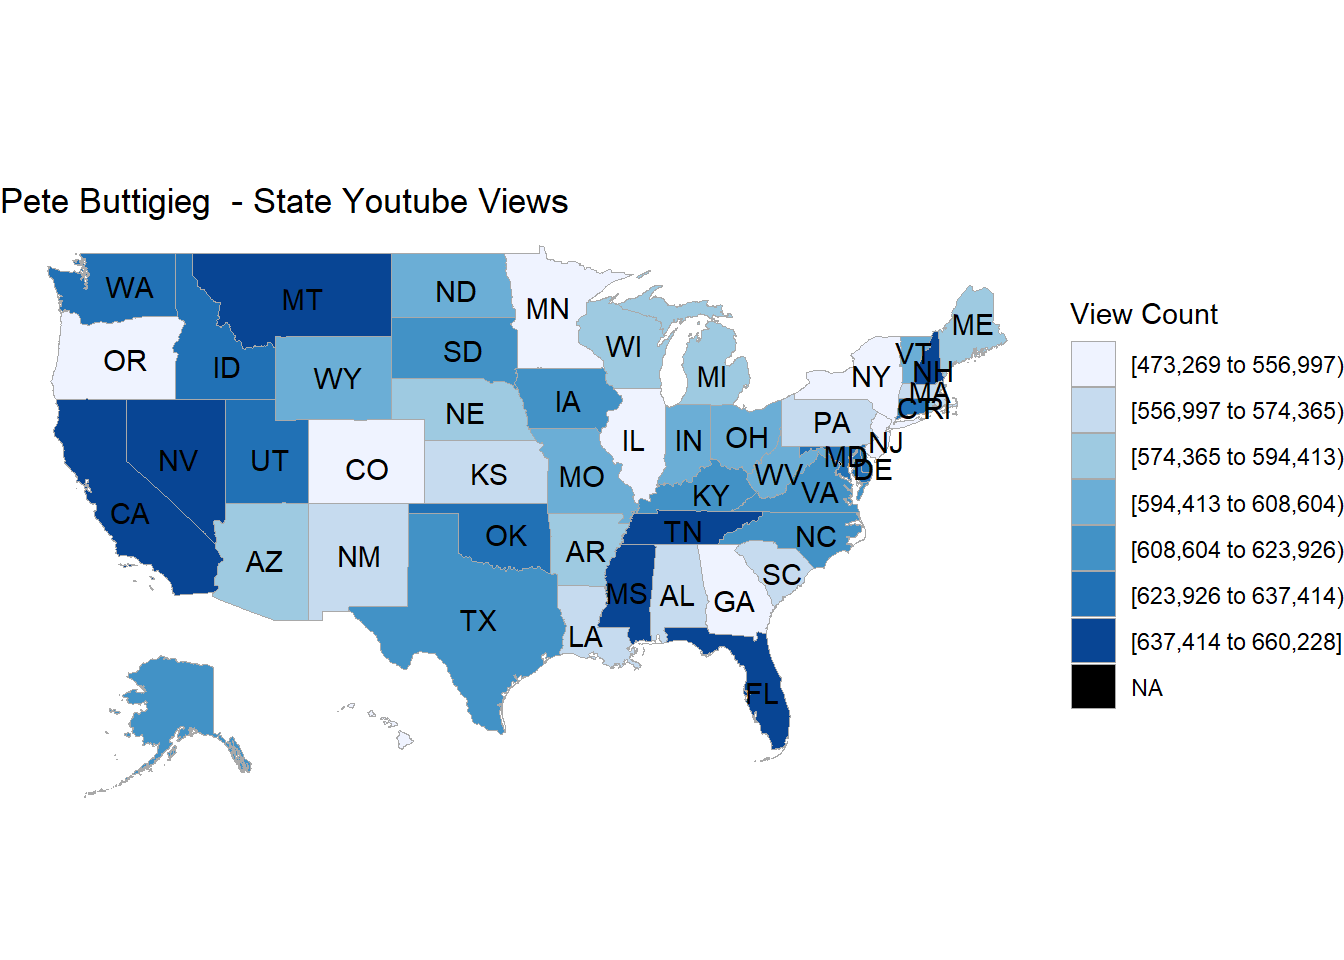
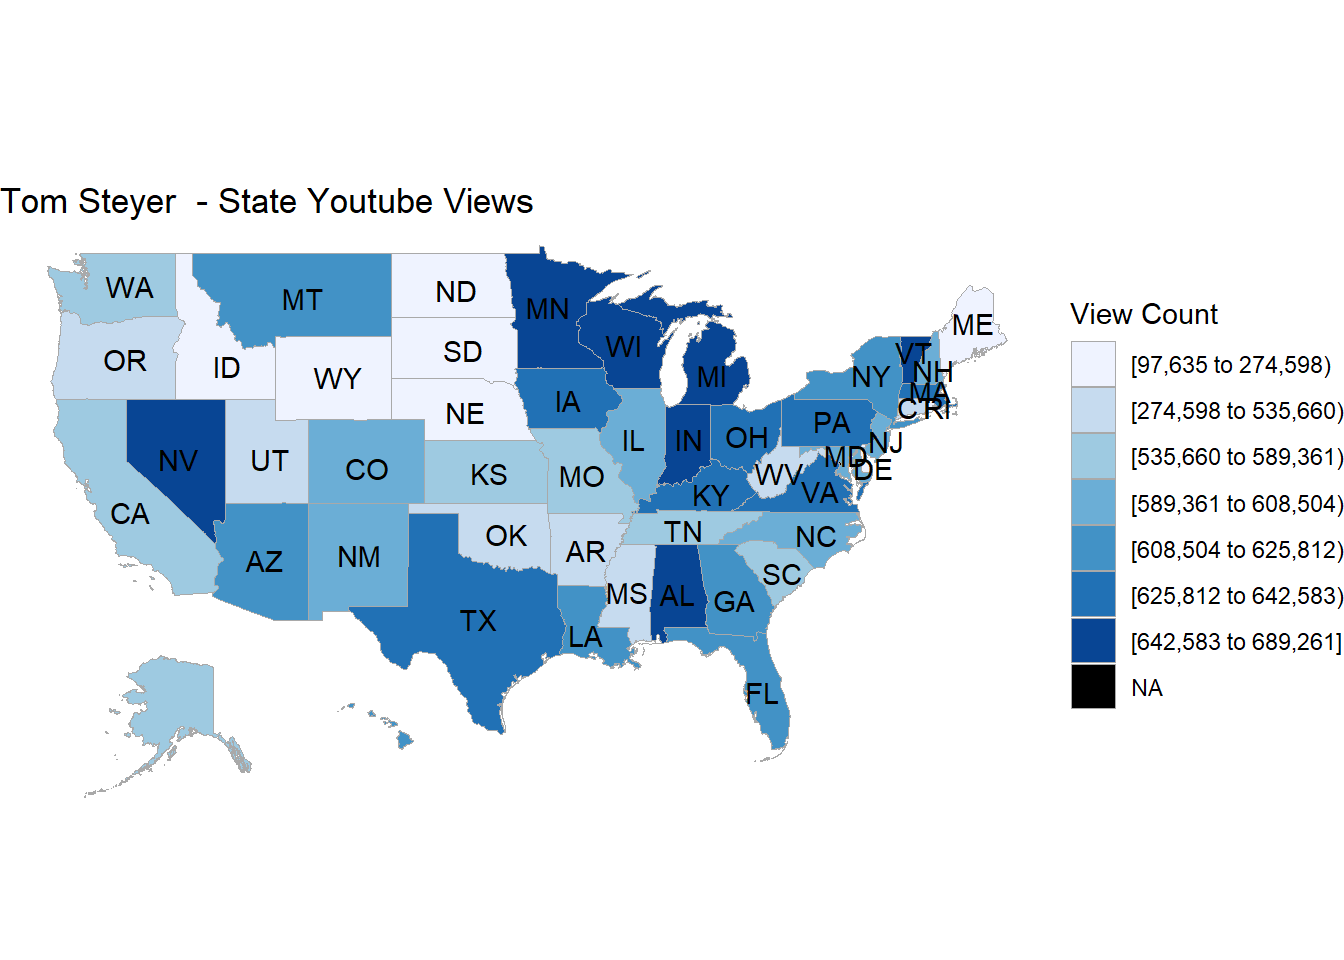
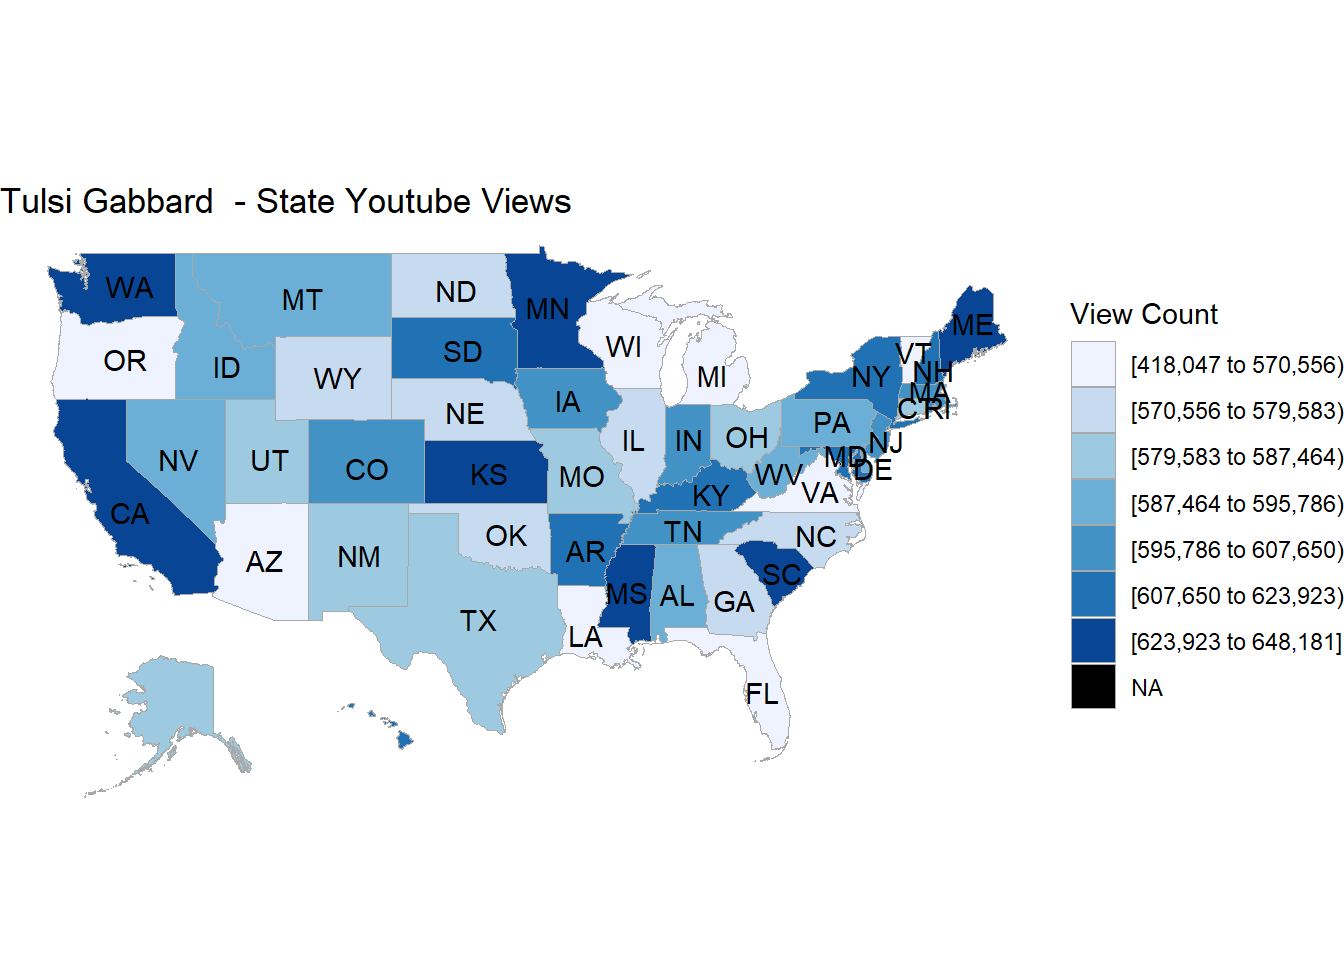
However, when we plot the youtube views per candidate per state, we do see some “missing data” in some states, this is due to the filter we were using when we pulled the original video data, like filter by 1 hour or 1 day, some candidates might have no data in some states, here is the intial plots we did:


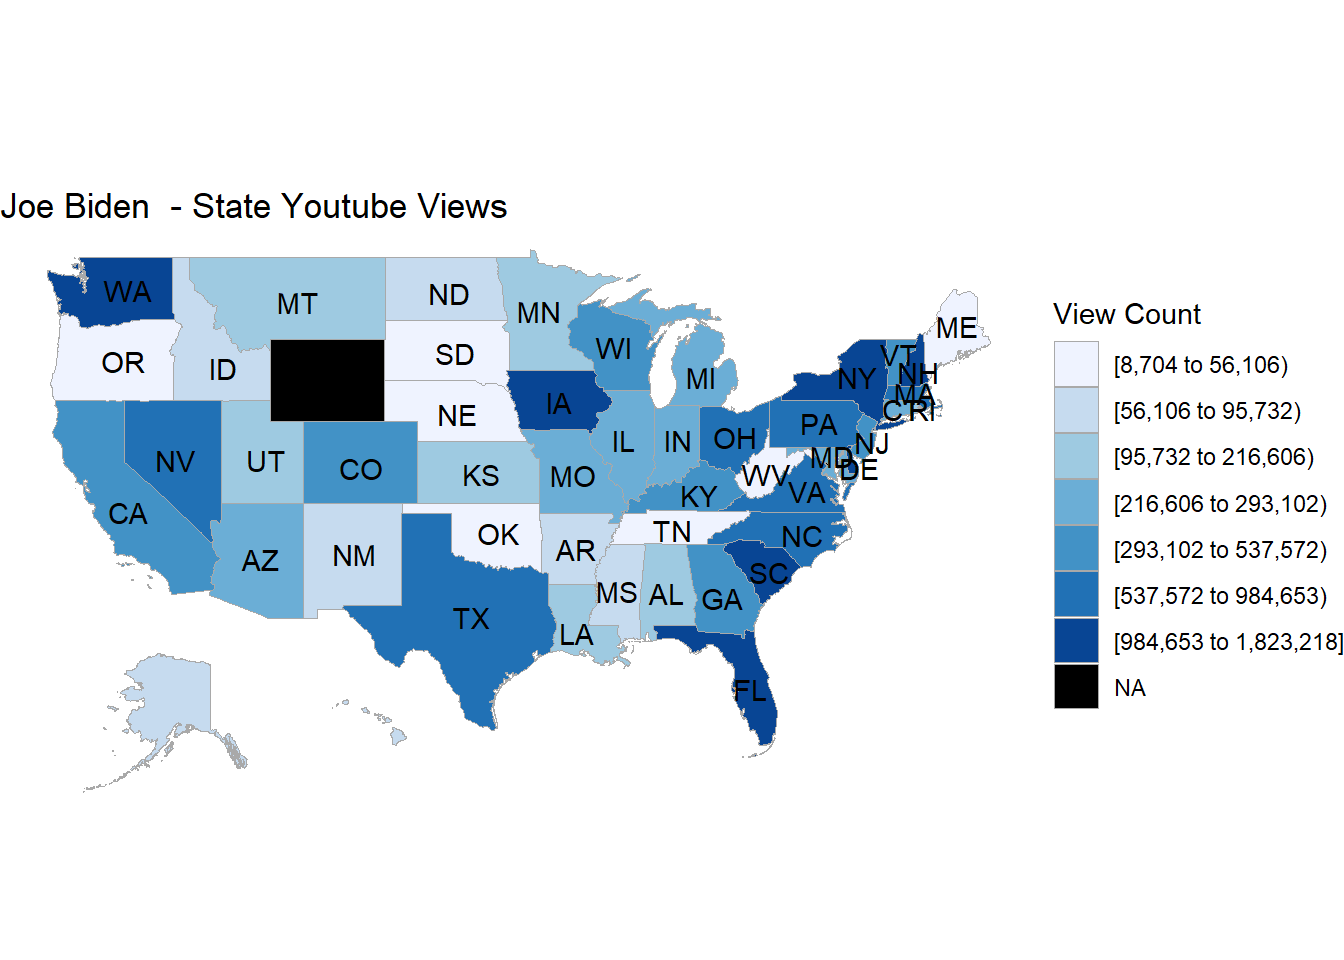
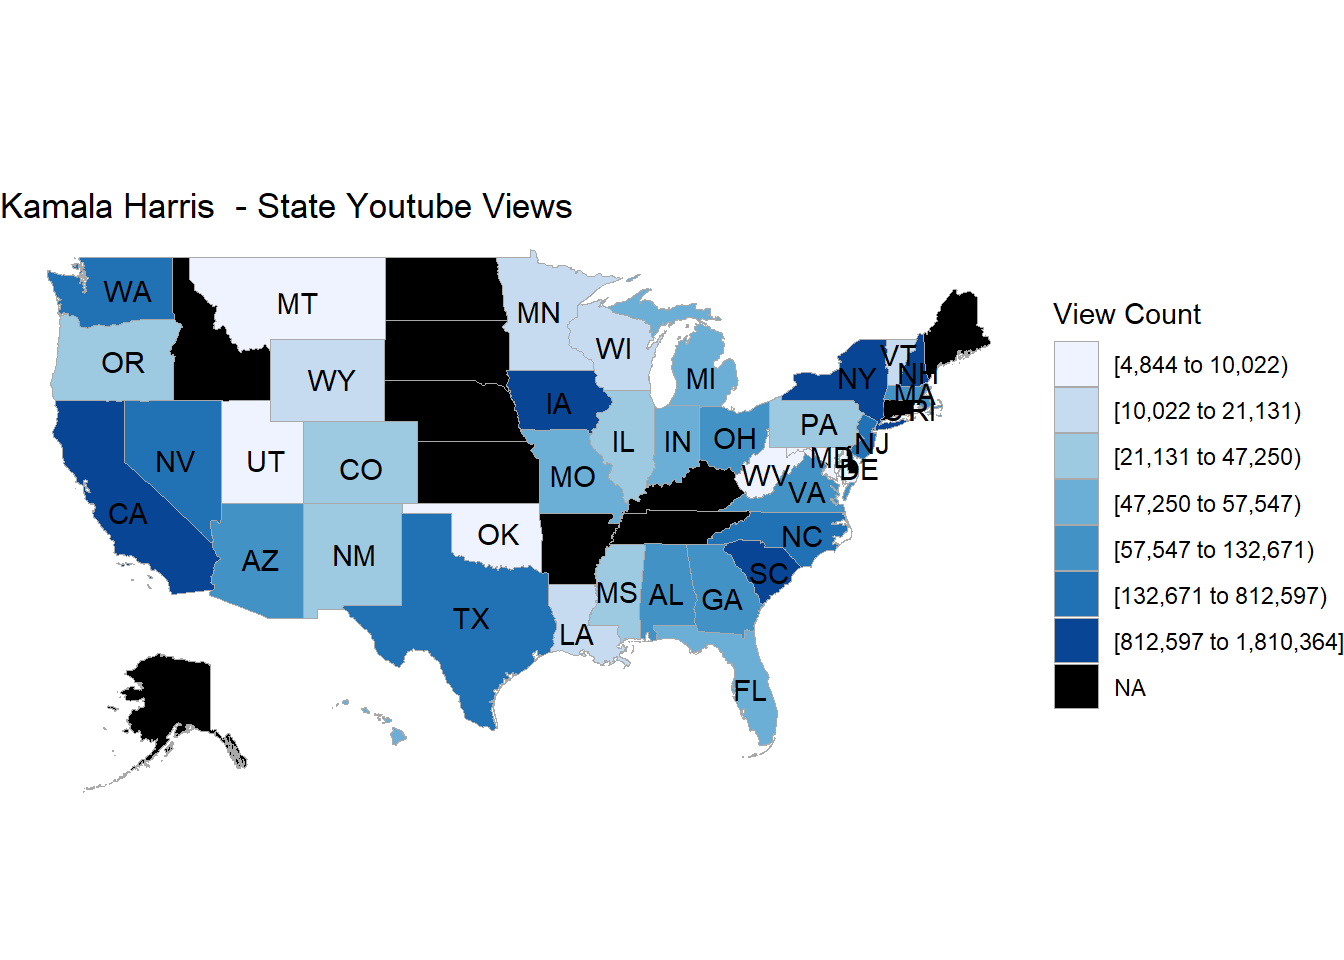
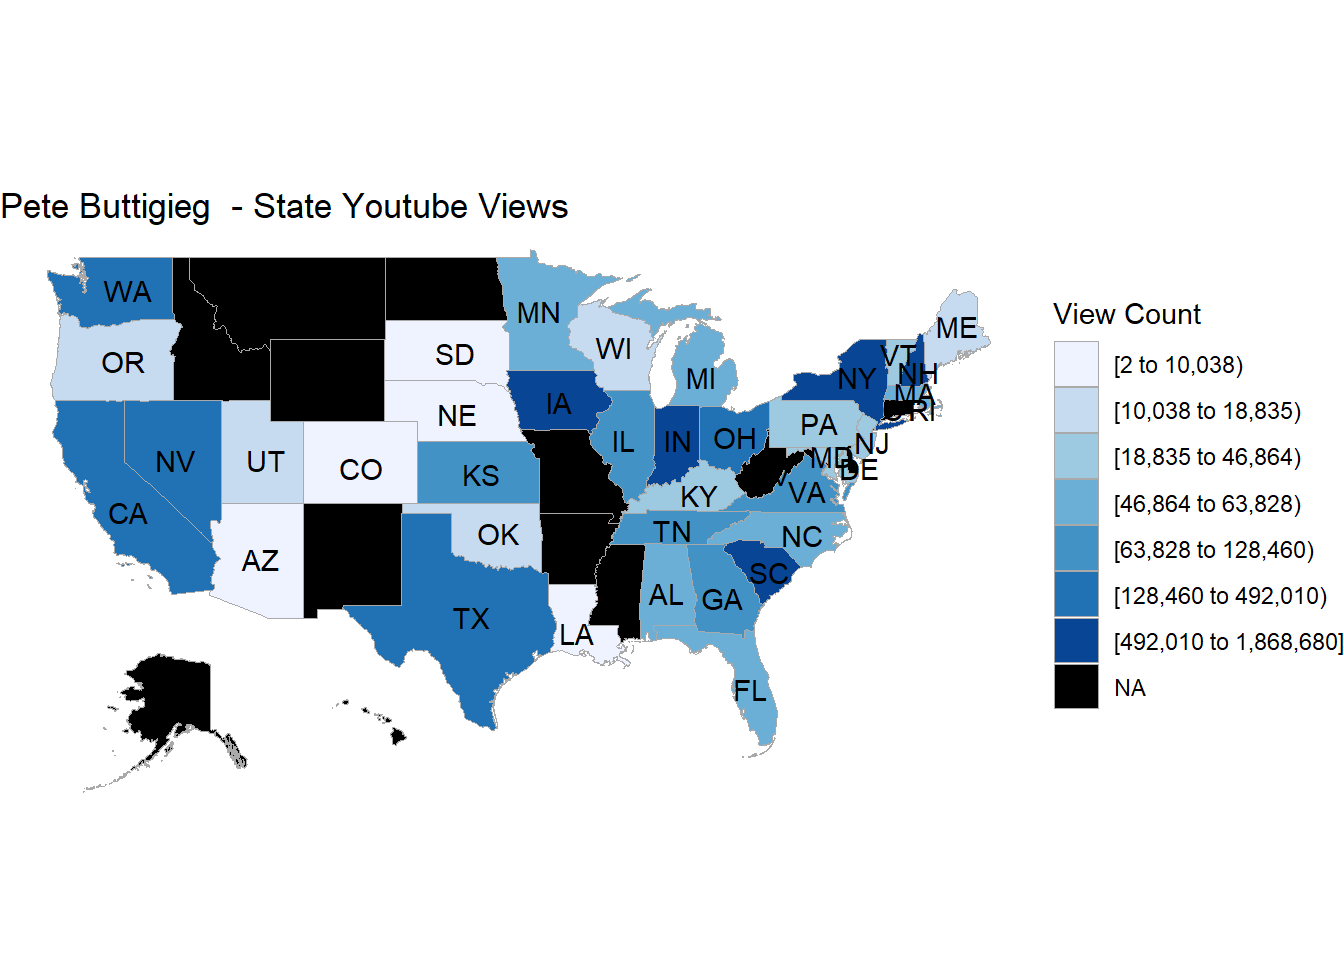
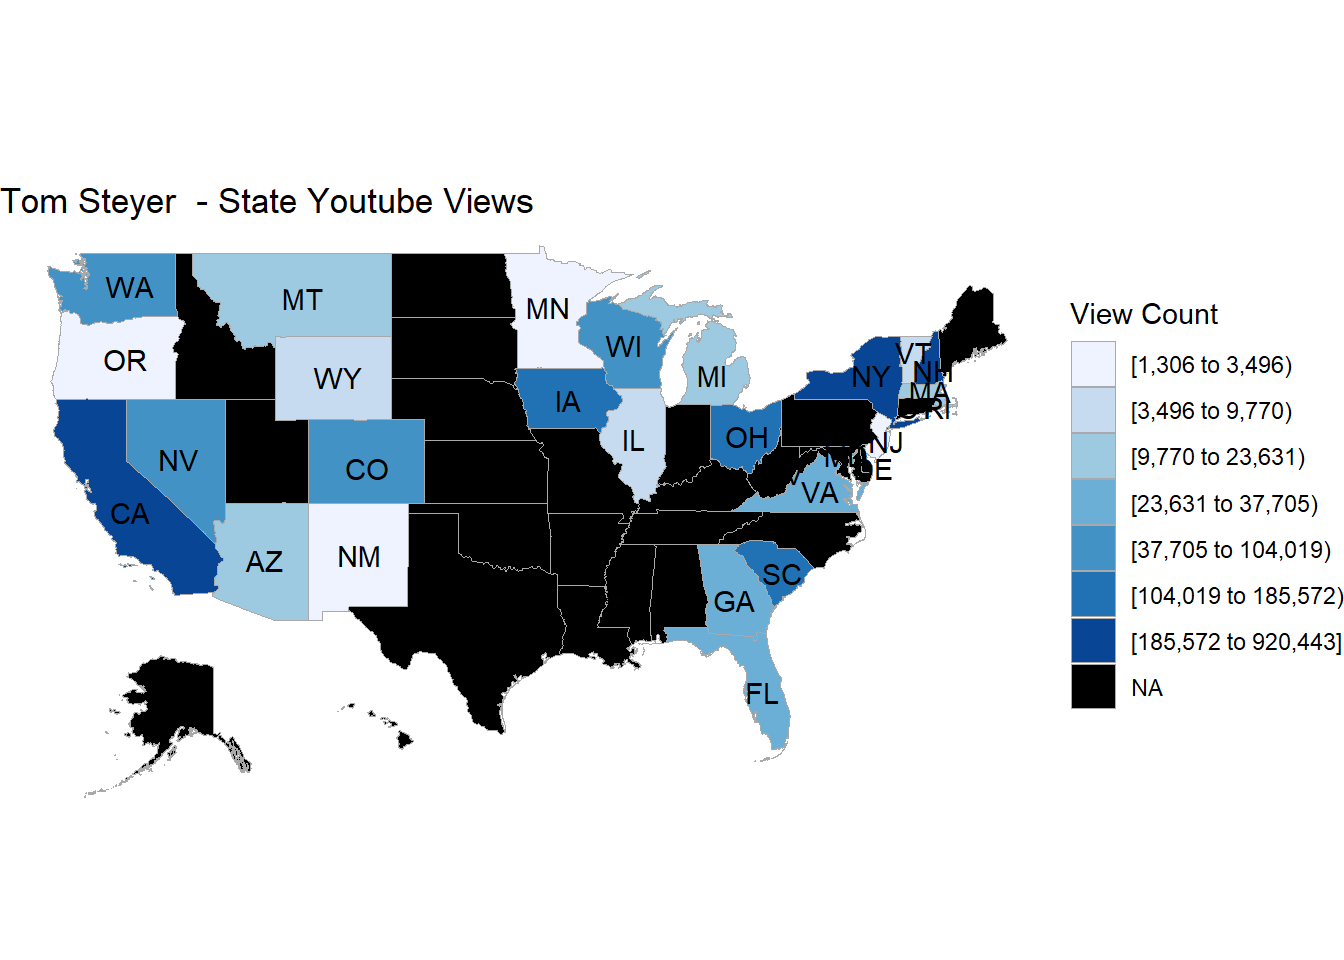
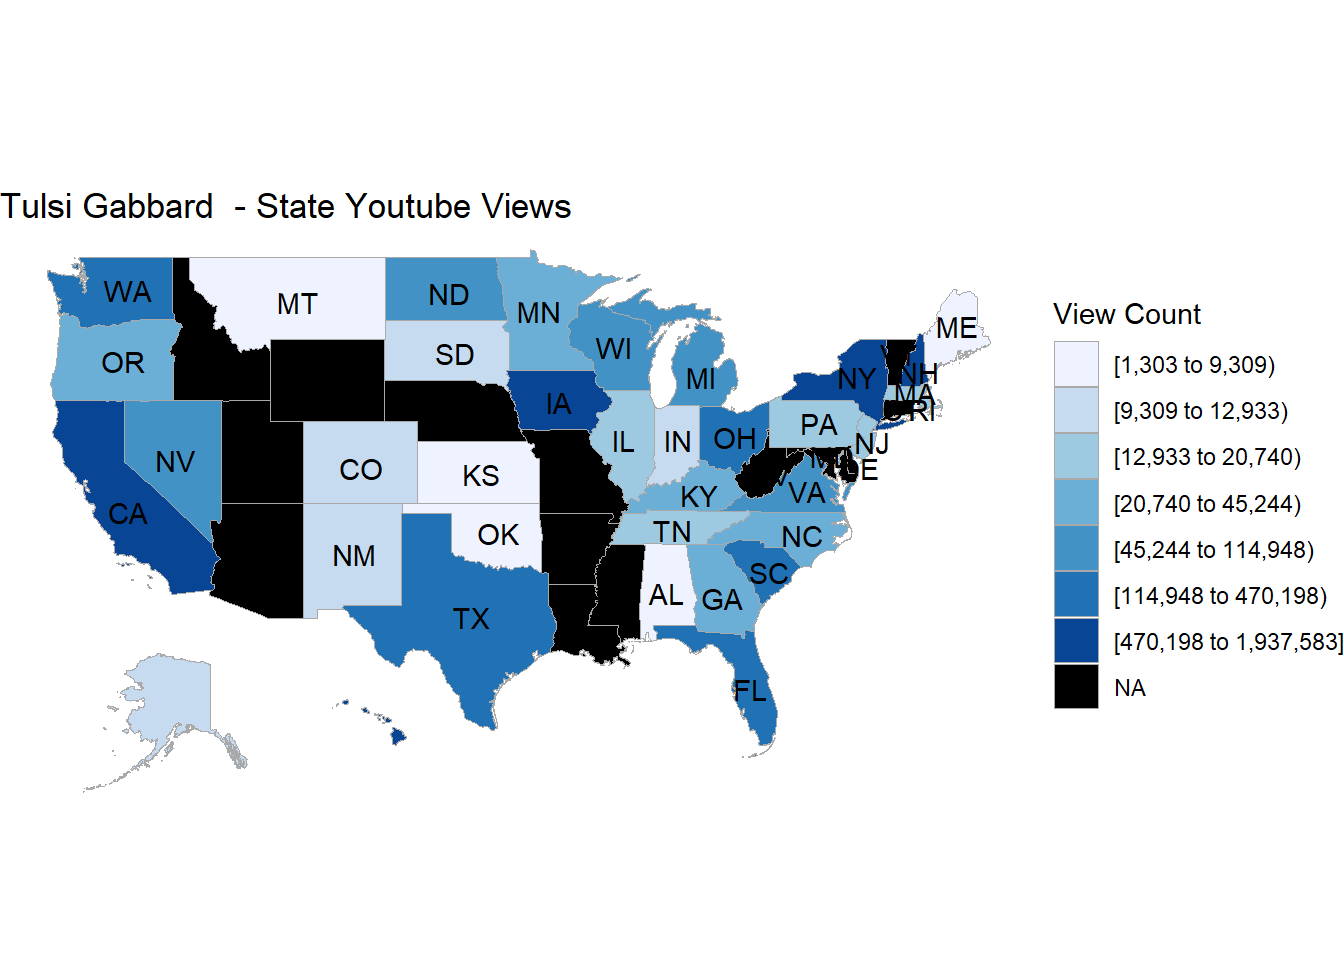
Note: The following regions were missing and are being set to NA: montana, oklahoma, delaware, wyoming, alabama, alaska, idaho, maryland, vermont, utah, kentucky, maine, connecticut, michigan, missouri, oregon, district of columbia, hawaii, illinois, indiana
4.2 Missing Data Solution
Then we have updated the parameter to expand our filter to a larger duration (1 momth, 1 year) and added re-try logic in the API call (The code snippet is shared in Chapter-2.4) to make sure we have pulled enough data per candidate per state, as you can see now from the plots based on the latest data, we don’t have any “missing data” this time!
Example (Data from December 2019)


